Data-centric exploration using intake, dask, hvplot, datashader, panel, and binder
Julia Signell | @jsignell
In this talk we will start with data files, ingest the data, do a quick first pass at visualization and end at a deployed dashboard, using a set of open-source packages that have been designed to work well together. In particular, the audience will learn to:
- ingest data from almost any file format with intake
- even large data thanks to dask
- quickly inspect pandas, xarray, or streaming data with hvplot
- interact with plots in web browsers using bokeh
- plot large datasets with datashader
- create dashboards with panel
- deploy dashboards on binder
Talk Structure
We will be exploring three different datasets:
- anaconda package download data (tabular, categorical, timeseries, stored as parquet, too big to fit in memory)
- satellite imagery (raster, geo-referenced, stored as geotiff)
- locations of trees (tabular, geo-referenced, stored as geojson, too big to plot as points)
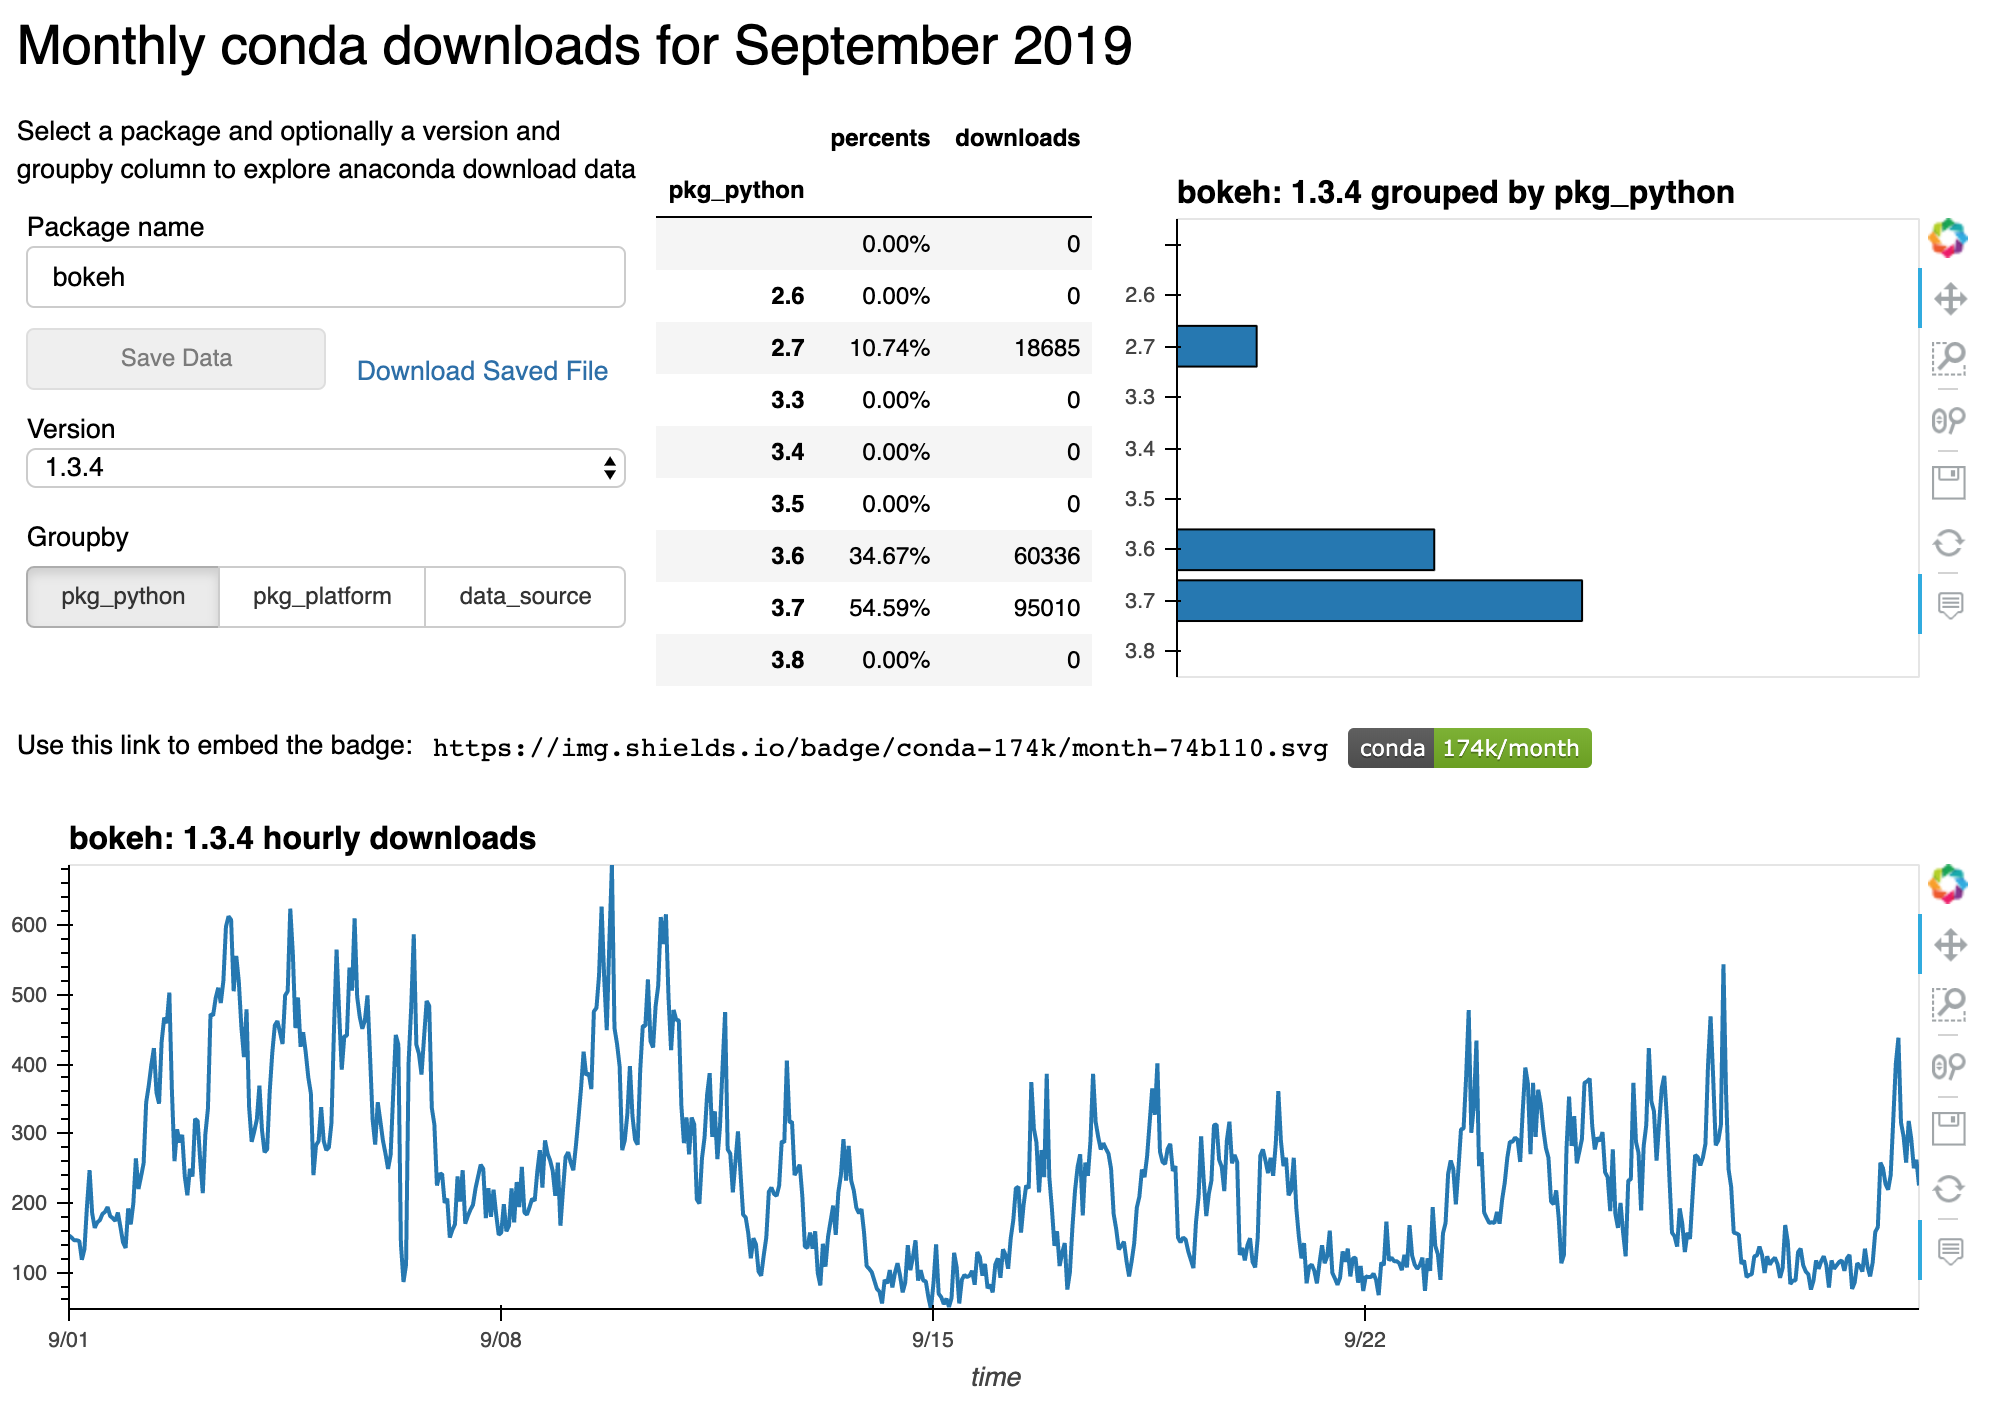
Case 1: Anaconda Package Download Data
We'll start by looking at anaconda package download data. These data are stored in daily parquet files and dumped in an s3 bucket. See the source code and access a running instance from https://github.com/ContinuumIO/anaconda-package-data. In this example we'll be mostly talking about intake and panel.
First - what is intake?
- provides a layer of abstraction between the data and the user
- captures the dependencies of a particular dataset
- reduces copy and pasting between notebooks
We're going to start by talking about some different ways to use intake.
Next - what is panel?
- provides APIs for interactivity
- allows others to explore data without writing code
- doesn't make you write javascript
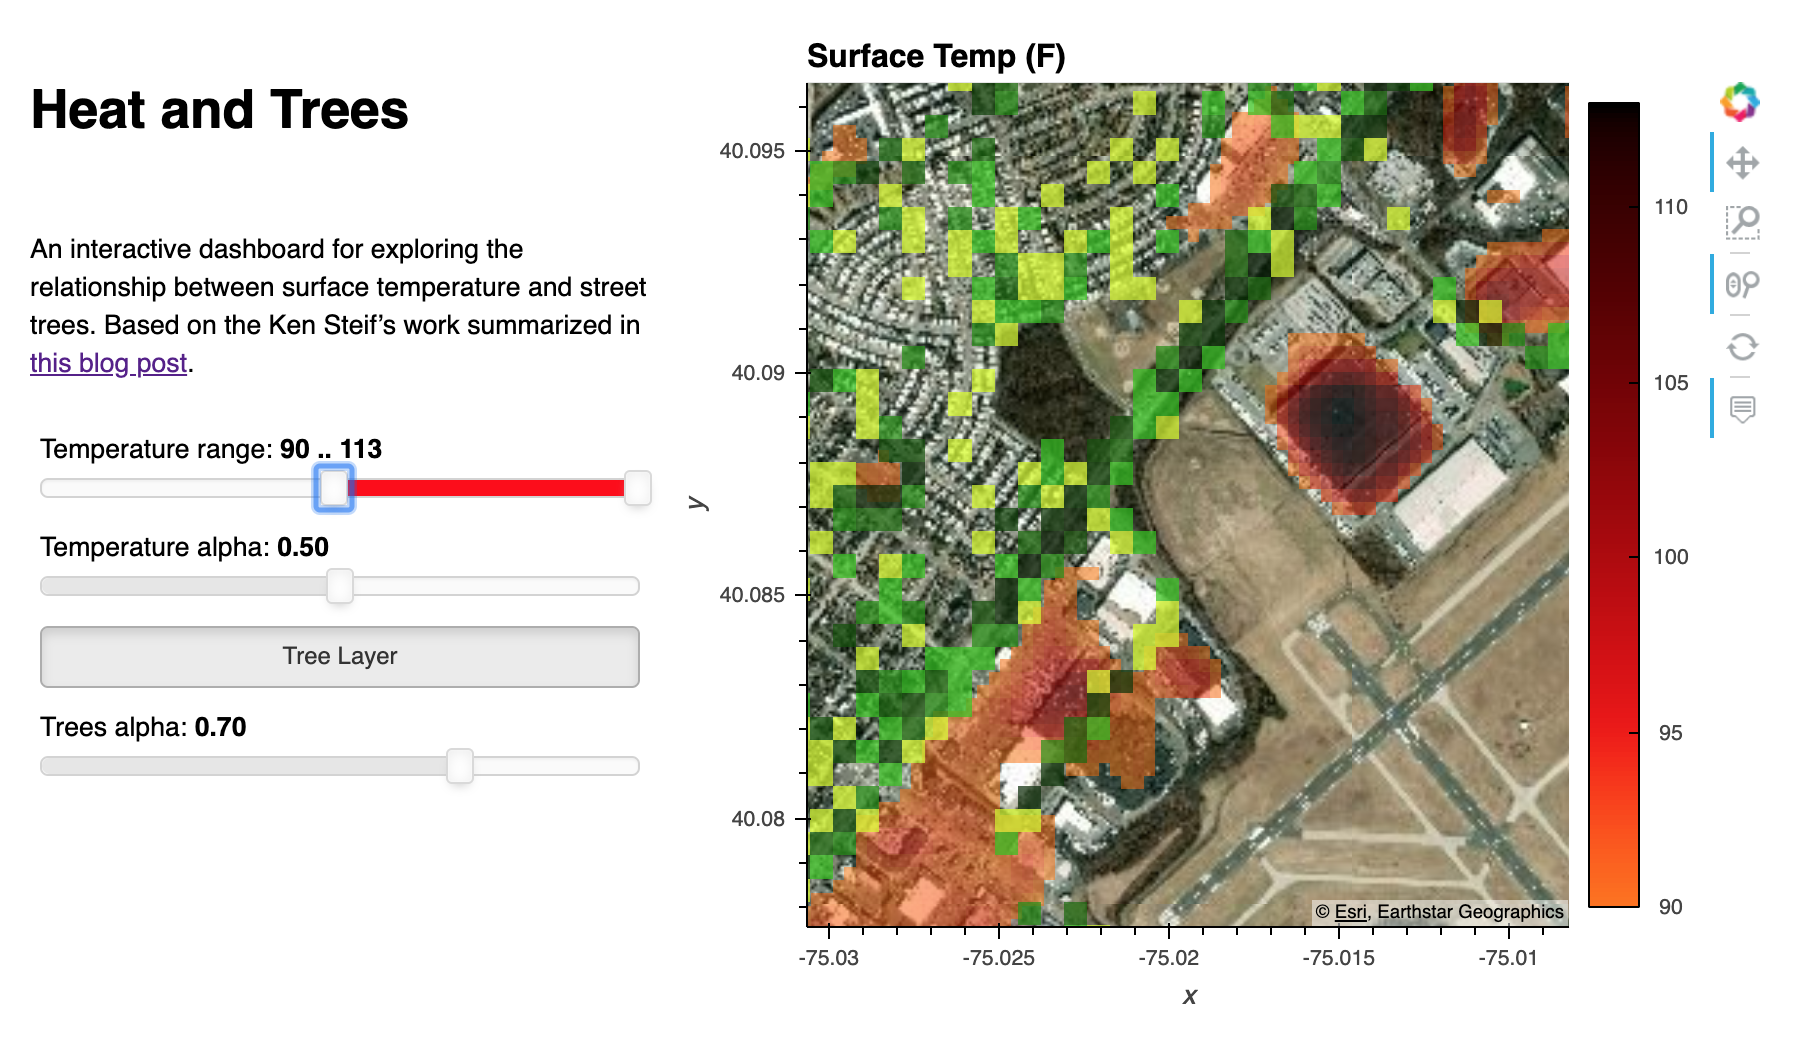
Case 2: Satellite Imagery/Locations of Trees
The second two datasets are actually related because we'll use them to explore the relationship between surface temperature and the location of street trees in Philadelphia. In this part of the talk we'll be focusing on how to create plots using hvplot. The materials for this part of the talk can be found at https://github.com/jsignell/heat_and_trees.
What is hvplot?
- mimics the
.plotAPI that you get in pandas - but instead of matplotlib outputs, holoviews objects - rendered in bokeh
- integrates with geoviews, datashader
- supports pandas, geopandas, dask, xarray, streamz